How We Use Scarf for Open Source Marketing
Open source projects generate a treasure trove of data (downloads, doc views, project usage), but most open source companies aren’t tapping into it. That interest is there, but how do you connect it to real business opportunities through marketing?
Open source projects generate a treasure trove of data (downloads, doc views, project usage), but most open source companies aren’t tapping into it. That interest is there, but how do you connect it to real business opportunities through marketing?
In traditional marketing, you track conversions (signups, demos, purchases). You can follow users from first touch to closed won. In open source marketing, it’s not that simple. Because open source is inherently anonymous, vanity metrics, like raw downloads and GitHub stars, don’t tell you how many potential customers are already adopting your project, or more importantly, WHICH COMPANIES they are.
At the end of the day, those vanity metrics are not enough. They signal popularity, but they don’t translate into paying customers. You can’t feed a sales pipeline with GitHub stars. Marketing a paid offering in an open source company starts with knowing who’s using the project and how they’re engaging with it, so you can reach the right people, whether through targeted marketing efforts, or direct sales outreach.
A company casually skimming your marketing site isn’t the same as one testing your open source project in production. But without the right data, they look identical. Knowing who is engaging and how deeply is hugely valuable.
That’s why we created Scarf. Open source adoption doesn’t happen in neat, trackable steps. It happens organically, over time, across different touchpoints.
Scarf helps solve these challenges (and more) for open source projects. We use it ourselves, every day, to improve our own marketing. Here’s how Scarf helps us, and how it can help you do the same with your marketing.
Our setup
Before we get into how we use this data, let’s talk about what we have in place to make it possible. Over time, we’ve built a system that helps us track and analyze most of our marketing activities. Every open source company is different, but we believe this setup will give you a useful starting point to create a system that works for your business.
Our setup is designed to capture real engagement data across multiple touchpoints.
- Pixels on our homepage and documentation tell us which companies are exploring our website and technical content.
- File Package URLs in our call-to-action buttons help us track who clicks on key resources, like “book a demo” buttons and blog posts.
- File Packages URLs in our campaign links allow us to measure which companies engage with our marketing activities.
Run Smarter Campaigns
Your users aren’t all the same—so why should your marketing be?
Leveraging company-level data on who’s engaging with our artifacts helps us:
- Identify which companies are engaging with our packages, landing pages, and documentation.
- Prioritize high-value accounts that are already showing strong interest.
- Run targeted campaigns to companies that have already engaged.
Why chase cold leads when you can focus on the ones who are already paying attention?
Using Data to Build Messaging That Resonates
Once you know who’s engaging and where they are in the adoption journey, the next step is making sure your messaging actually speaks to them.
With Scarf, you can track your open source artifacts and see which companies are engaging with them. Monitor your packages, landing pages, documentation, or even send telemetry from your app to get a complete picture.
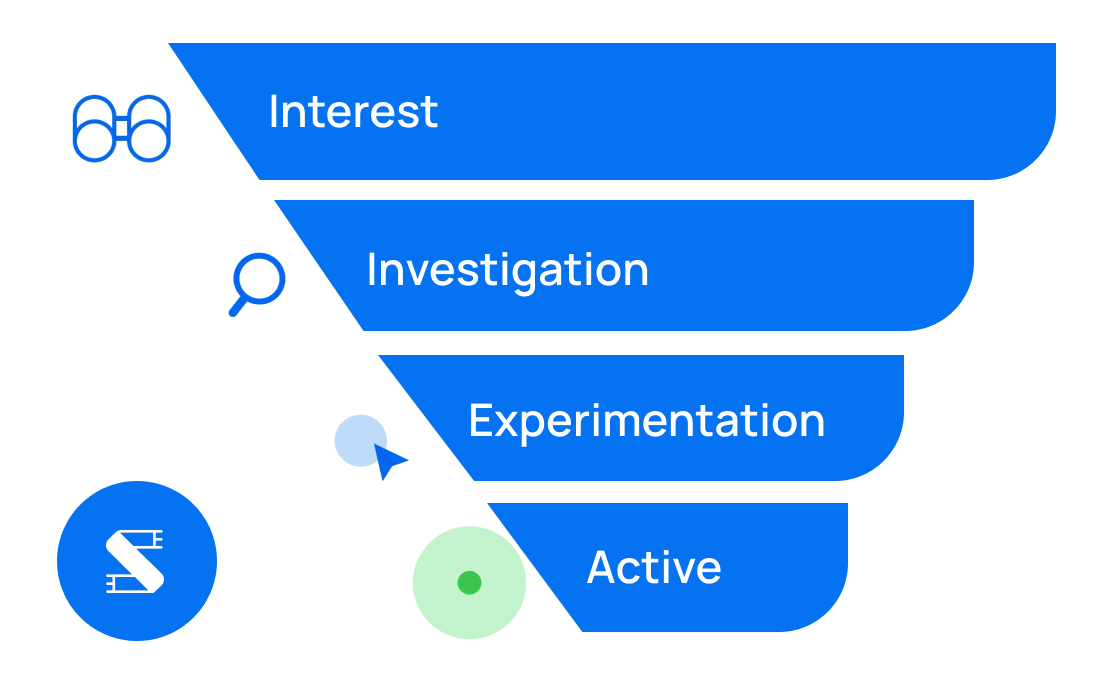
Scarf also helps you understand where companies are in the open source adoption funnel. A company casually browsing the docs is in a different stage than one actively integrating a package. We use these insights to:
- Tailor content and language for the early interest stage or deeper, ongoing usage.
- Identify key adoption patterns to create different campaigns and highlight the features that are most relevant to your audience.
- Identify friction points and where in the open source funnel users tend to drop off and optimize that step.
- Guide companies from one stage to the next by addressing their specific needs.
How we do it
Once we have this data, we use it to run more effective campaigns and outreach.
First, we identify which companies have interacted with Scarf in the last six months. Scarf tells us the name of the company that has engaged with our content, when and if they have interacted with other types of content before, and where they are in the open source funnel.
Next, we filter by funnel stage. If we’re running a top-of-funnel campaign, we focus on companies in the “interest” or “investigation” stages—those engaging but not yet considered a “hot lead.” If we’re targeting companies further along, we refine our list to those actively evaluating Scarf.
Then, we tailor our messaging based on that funnel stage. The way we communicate with someone discovering the product for the first time is different from how we engage with someone actively evaluating it with purchase intent. The language we use and the campaigns we run reflect that.
Finally, we export our list and launch campaigns where they’ll be most effective. Instead of casting a wide net, we import targeted audiences into LinkedIn, Google Ads, or other platforms. That ensures our outreach reaches the right companies at the right time.
Learn more about the open source adoption funnel and how you can use Scarf to identify them in your project.
Know Which Companies are Clicking and Downloading
Marketing doesn’t stop at people visiting a landing page, what happens next is just as important. With Scarf Pixels and Packages, we track how companies interact with all of our resources. It helps us learn:
- Which pages get the most engagement.
- Where users drop off.
- Which companies are actively exploring marketing pages and docs.
- Who’s engaging with your paid campaigns and what they are doing after that.
Seeing this data in real-time lets us understand what’s working, what needs improvement, and how to better guide users further down the funnel.
How we do it
After running a campaign, we can identify which companies clicked on our ads, call-to-action buttons, or marketing resources.
From there, we take action in a few key ways:
- Run retargeting campaigns for companies that clicked but didn’t convert. If they showed interest, we can follow up with messaging that better aligns with their new stage in the funnel.
- Pull new companies into the next campaign. We can repeat the process with fresh company names, expanding our reach while continuously refining our targeting.
- Pass high-intent leads to sales. If a company qualifies as a marketing-qualified lead (MQL)—based on engagement level, multiple touchpoints, or deeper interactions—we flag them for direct outreach.
If you want to understand how to use Scarf to track your users’ interactions with your project, read this playbook.
Show the Impact of Your Marketing Efforts
How do you know if your marketing efforts are actually driving results? How do you know what strategies are working and which ones could be improved? With Scarf, you can connect marketing activities—like driving traffic to your documentation—to real open source usage.
We use these insights to:
- Track how documentation visits, package downloads, and clicks change over time as a result of marketing activities.
- See which companies are interacting more (or less) after a campaign.
- Measure the real impact of different outreach efforts on adoption.
- Know where to double down and where to adjust.
With this data, we can see what’s working and make data-driven decisions on where to focus next. And if we’re asked, we can demonstrate exactly where marketing is driving results and how it’s influencing user engagement across our ecosystem.
How we do it
Since we track our campaigns using File Package URLs combined with UTMs, we can filter and analyze engagement right inside Scarf.
We start by filtering campaign data by source. If traffic comes from Google, LinkedIn, email, or another platform, we can isolate engagement by channel and compare performance. From there, we break it down further by medium, whether it’s a paid campaign, organic search, or social media. This helps us see where the most valuable interactions are happening.
We also look at post-click activity, identifying whether companies explore documentation, click a call-to-action button, or return later.
To go deeper, we filter by funnel stage. If we want to understand the true impact of a campaign, we look at whether more companies are moving from early-stage interest to deeper evaluation. The fluctuation in the number of companies at each stage is just as important as the influx of new companies entering the funnel for the first time.
Unify Your Data for a Complete Picture
Tracking the data is not the end of the story. Data is only useful if it actually makes it to the right teams. Marketing, sales, and community teams all need a full view of how companies are engaging with the open source project.
With Scarf, you can sync open source insights directly with Salesforce and HubSpot, combining them with your existing sales intelligence. Want to use another platform? No problem. Export manually or automate data flow with Scarf’s API to make sure your insights are exactly where you need them.
Learn more about exporting your Scarf data to external tools in this playbook.
Bringing It All Together
Tracking which companies interact with Scarf allows us to create targeted campaigns that reach the right audience at the right time. The way we speak to those just exploring is different from how we engage companies that are ready to test out the product. This is why knowing in which funnel stage different companies are is so important. A casual visitor browsing documentation isn’t looking for the same information as a company actively engaging with sales, so we tailor our outreach to match their needs.
Here’s a quick checklist to help you put what we learned here into action:
- ✅ Implement Scarf Pixels and Package tracking: Ensure basic data collection is active on key artifacts like marketing page, documentation and packages.
- ✅ Identify high-value company engagement: Regularly review Scarf data to find companies showing strong interest.
- ✅ Tailor messaging based on open source adoption funnel stage: Use Scarf insights to create content and outreach that matches where companies are in the adoption funnel.
- ✅ Connect Scarf data to Sales/CRM: Integrate Scarf with Salesforce/HubSpot to unify data and inform sales outreach.
- ✅ Track campaign impact on MQL conversions: Measure how marketing efforts directly impact lead generation and conversions.
Once we know who’s engaging, we make sure messaging reflects what matters to them. Scarf shows us how users interact with key content like documentation and landing pages, helping us refine messaging and remove friction points. When users drop off at a specific section, we know where improvements are needed. When a feature drives more attention, we emphasize it in our outreach.
We track campaign performance, but more importantly, we use Scarf to create the right systems to understand how it connects to real usage. When product engagement spikes or drops, we can tie it back to specific efforts and make informed decisions about what’s working and what needs to change.
All of this works together to create a cycle of continuous improvement. Every campaign we launch, every message we refine, and every insight we track helps us make informed decisions about the next steps.
Want to see how Scarf can help you do the same? Book a demo!
Getting the Most Out of Your Company Unlock Credits
Company unlocks are most useful when you filter, size, sort, and schedule them around the organizations you actually care about.
What 3,600+ Maven Central publishers do after claiming their namespace on Scarf
Scarf has now onboarded 3,693 open source organizations from Maven Central as part of our partnership with Sonatype. We now have a meaningful signal on how these teams are leveraging Scarf most effectively.
Introducing Dependency Radar
A new real-time supply chain security feed from open source downloads tracked by Scarf
