Harnessing Software Download Patterns: Using Open Source Download Metrics to Uncover New Users and Potential Customers
Did you know your user's download patterns can reveal a great deal of information on who your users are and how they are using your software? For instance, repeated downloads show continued usage or a slowing rate of download activity can show potential churn.. If you're not examining these patterns, you're potentially missing out. We have been working on discerning these patterns for a while now; let me show you a few things we learned and how we analyze downloads.
Introduction:
Did you know your user’s download patterns can reveal a great deal of information on who your users are and how they are using your software? For instance, repeated downloads show continued usage or a slowing rate of download activity can show potential churn.. If you’re not examining these patterns, you’re potentially missing out. We have been working on discerning these patterns for a while now; let me show you a few things we learned and how we analyze downloads.
Understanding the Scarf Gateway:
Here at Scarf, we’ve developed a solution to help open source projects and businesses gain more insight into their users and their download traffic - Scarf Gateway. One of the challenges with tracking downloads for open source projects is the diversity of software distribution methods. Often, these distribution methods are controlled by third parties who retain, but do not share, detailed information about your downloads. Scarf Gateway is designed to help you track those downloads across different sources. Here’s how it works.
Scarf Gateway operates much like a link shortener, such as bit.ly, acting as a domain gateway to redirect traffic. However, what sets Scarf Gateway apart is its specific design compatibility with various APIs used by different software hosting and distribution services.
To use Scarf Gateway, you’ll need to create a route between it and your current packages, containers, or downloads. This route will direct the gateway to fulfill requests. You’ll then set up a custom domain that resolves to your gateway’s location and update your documentation, readme, and other sources with the new domain. As a result, users should be able to use the same install, pull, or download commands as they did before.
Analyzing Download Records:
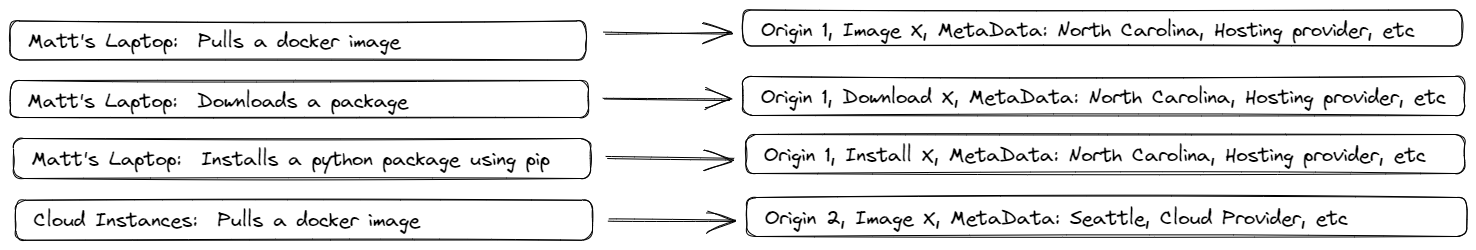
Within Scarf Gateway, we distill download metadata into endpoints or ‘\unique ‘origins,’ as we refer to them. When a user executes a Docker pull request to a project using Scarf, the machine initiating the request becomes an origin in our system. This process allows us to correlate multiple actions across different endpoints, all while keeping users’ ultimate identities and personally identifiable information (PII) safe, even from Scarf itself. The same principle applies when a user is browsing documentation or readmes with Scarf enabled.
At Scarf, we’ve developed a solution to help open source projects and businesses gain more insight into their users and their download traffic - Scarf Gateway.
As depicted in the graphic, origin 1 has downloaded three packages using three different methods, whereas origin 2 has only downloaded one package.
Deciphering Download Metrics:
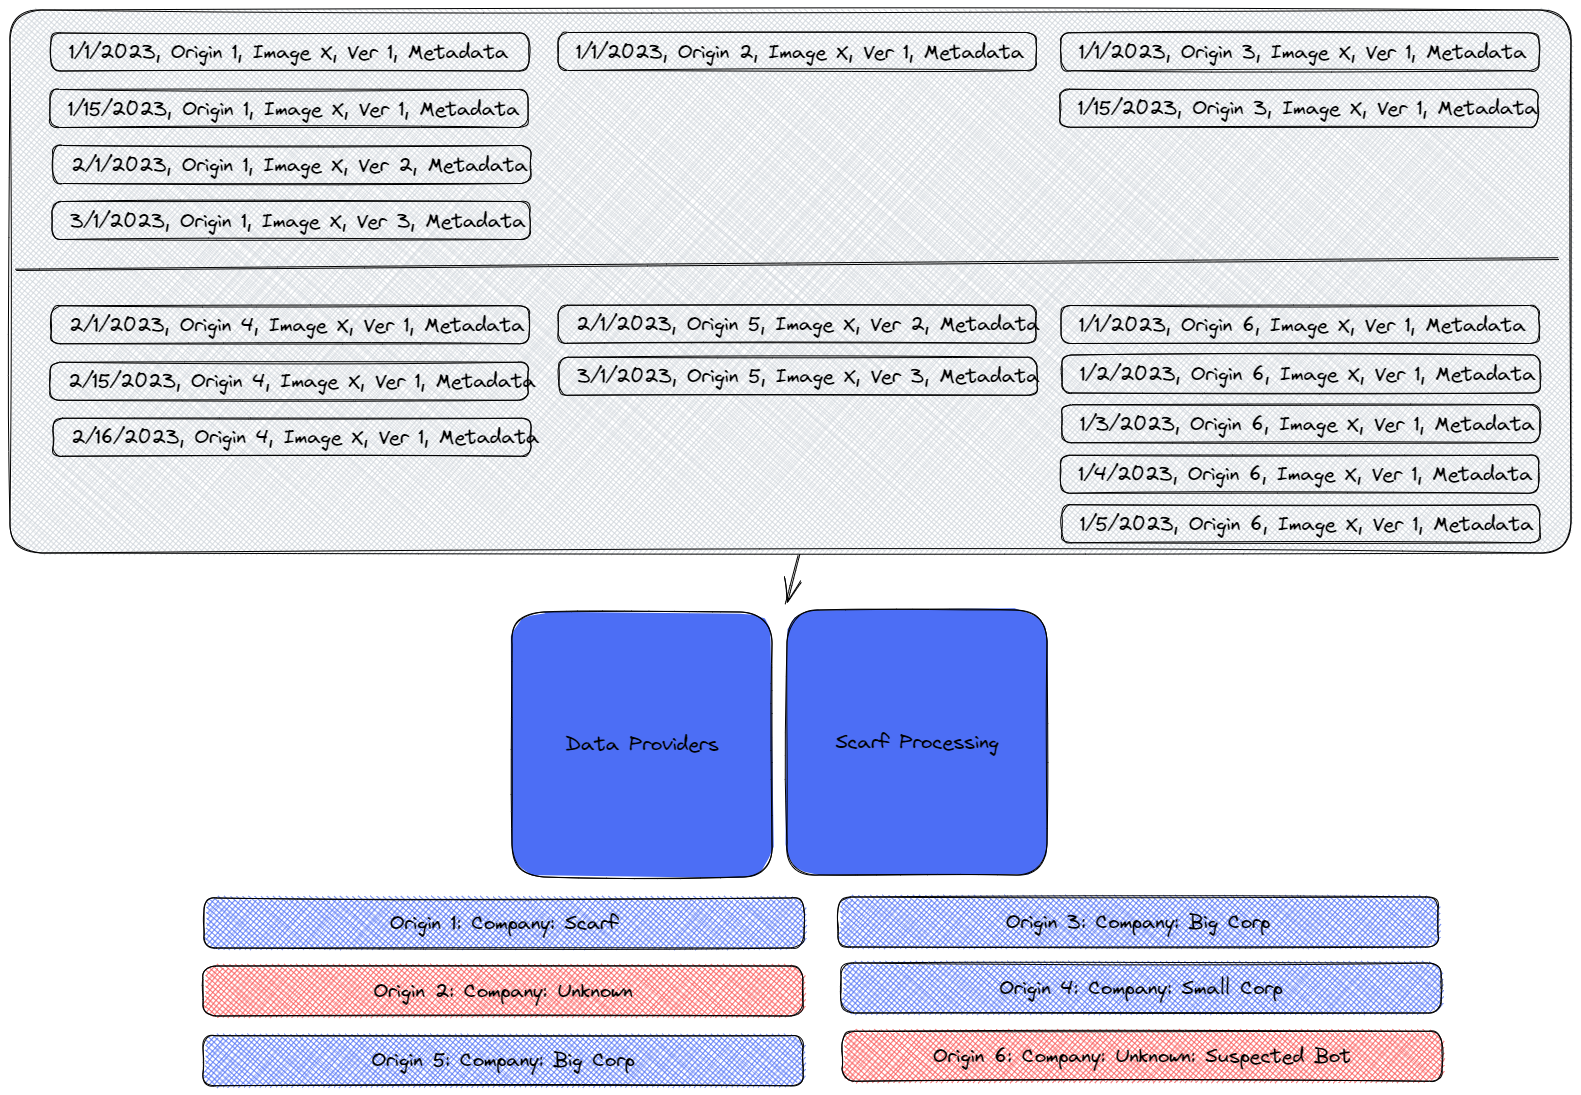
As events flow into the gateway, they are scrubbed and stored. We then process these events using third-party data providers who, based on the available data, can match origins to companies and fill in missing metadata.
As demonstrated in the below graphic, we are able to match origin 1 with company A, origin 2 with company B, and so on.
Scarf Gateaway is designed to help you track software downloads across different sources regardless of the software distribution method.
Discerning Download Patterns:
The graphic above represents an interesting array of download patterns. For instance, someone at Scarf has downloaded every major version of the software as it has come out, indicating that Scarf is likely a user of our open source software. We can’t identify Origins 2 or 6, suggesting that these could be random tests or drive-bys. Interestingly, Origin 6 appears to be a bot based on metadata and the download frequency. Note: we often observe CI systems, package mirrors,web crawlers and other bots generating a considerable amount of traffic without any real users behind them. In contrast, Origin 4, identified as “Small Corp,” has downloaded the same version repeatedly over time but hasn’t tried the latest version yet.
The graphic also shows that Origin 3 and 5 are, in fact, the same organization, “Big Corp.” They have downloaded every version of our software over the same period but from different endpoints. Transient endpoints are commonplace in today’s systems. In this scenario, being able to distill these event streams into a single organization tells us that Big Corp is using this software and keeping up-to-date with the latest releases, making them more likely to be a real user.
Based on this data, as depicted in the graphic, we can conclude that while there are six endpoints downloading the software, only three can be realistically identified as verifiable organizations.
It is crucial to drill down into these metrics to extract real, usable data, but also know what you are looking at as you can infer incorrect conclusions if you don’t have a grasp on the data.
Don’t Misinterpret Results:
For this project, we recorded:
- 17 downloads
- 6 unique downloaders
- 3 real, verifiable users
Now, if we were to report solely based on raw download metrics, the numbers would appear almost six times higher than the actual count of real users. This discrepancy can falsely depict growth where there may be none. It’s important to consider the temporal nature of the data involved here.
Looking over time periods this data can also easily lead to the wrong conclusions. For example, if you’re looking at raw downloads, you might see:
- 10 downloads in January
- 6 downloads in February
- 1 download in March
Seeing these numbers drop for 3 months in a row might raise concerns about your project’s growth. But remember, if there’s a significant number of bot downloads, these numbers can easily be skewed and misrepresent actual user engagement.
Correlating Downloads and Documentation Views:
In the example mentioned above, we identified six different origins downloading our software, two of which could not be fully identified, and three appeared to be unique companies.
Unidentified origins often come from cloud providers, co-located servers, or ephemeral environments. This is where combining download data with data from interactions with documentation, tutorials, and the like becomes valuable. Regular access to a project’s documentation by engineers is a strong indicator of a company using or evaluating your software. Repeated patterns of downloads and documentation views from a company over several months can instill high confidence that the company is actively using your software.
Download & User Metrics For Different Roles:
Why download data is beneficial for different internal departments using Scarf Gateaway.
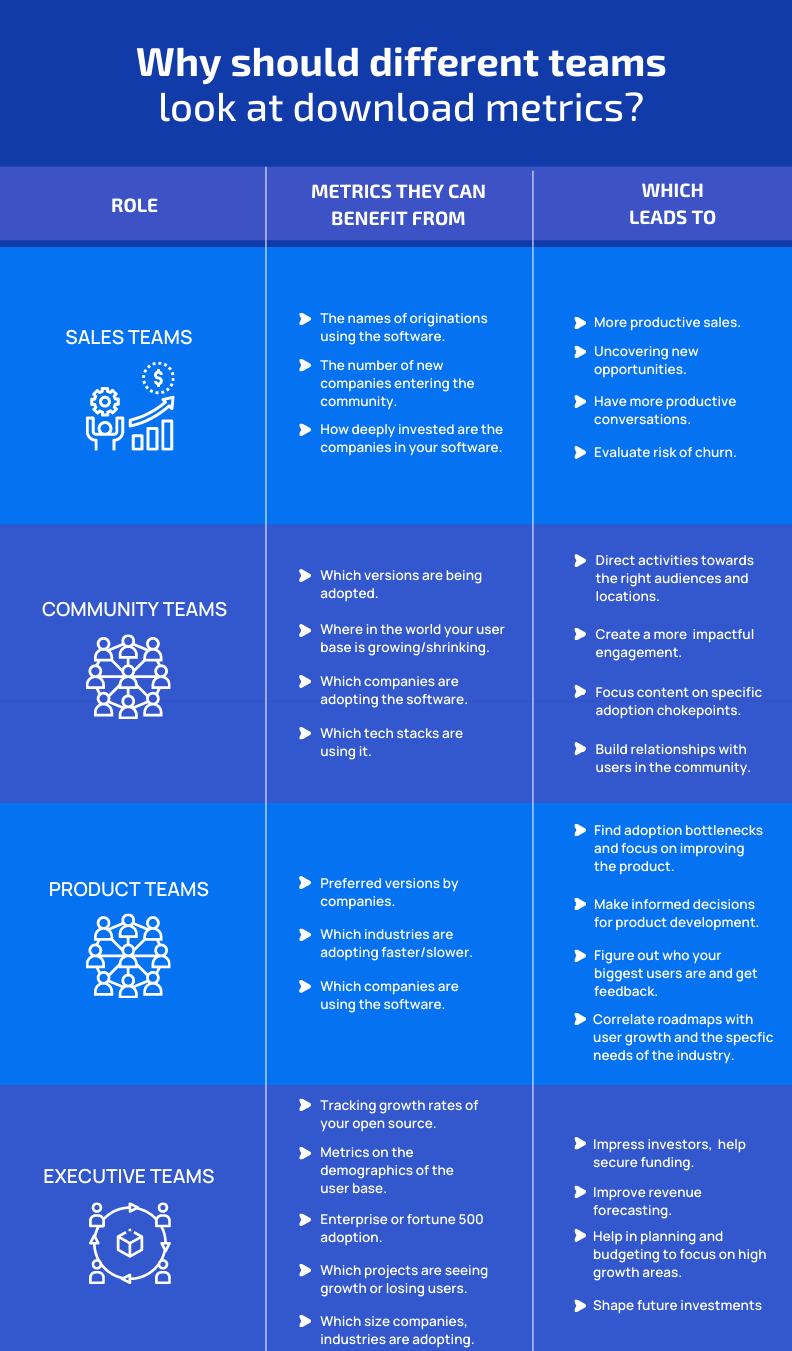
While the importance of this data might seem obvious to some, let’s delve into why it’s beneficial for different internal departments.
Sales teams can benefit enormously from knowing which companies are using your software. This insight allows them to target potential customers more effectively and have more productive conversations.
Community teams can use this data to understand which versions, components, and companies are adopting your software. This insight helps direct activities towards the right people and audiences, creating a more efficient and impactful engagement.
For product teams, monitoring overall adoption is crucial. But equally important is understanding if users are adopting the latest versions and how they are deploying and using the software. This insight can guide decision-making for product development and improvements.
Finally, for executive teams, understanding the market, the growth, and potential opportunities is paramount. This knowledge aids in planning for additional funding, determining where to focus investments, and shaping short and long term strategic plans.
In conclusion, understanding your software download patterns can significantly influence various aspects of your business, from sales and community engagement to product development and executive decision-making. With tools like Scarf Gateway, you can effectively harness this potential and drive your business toward greater success.
Beyond the Surface: How to Engage with the Quiet Members of your Open Source Community
In the dynamic realm of community management, marketing, and developer relations, success depends upon more than just attracting attention. It's about fostering meaningful relationships, nurturing engagement, and amplifying your community's impact.
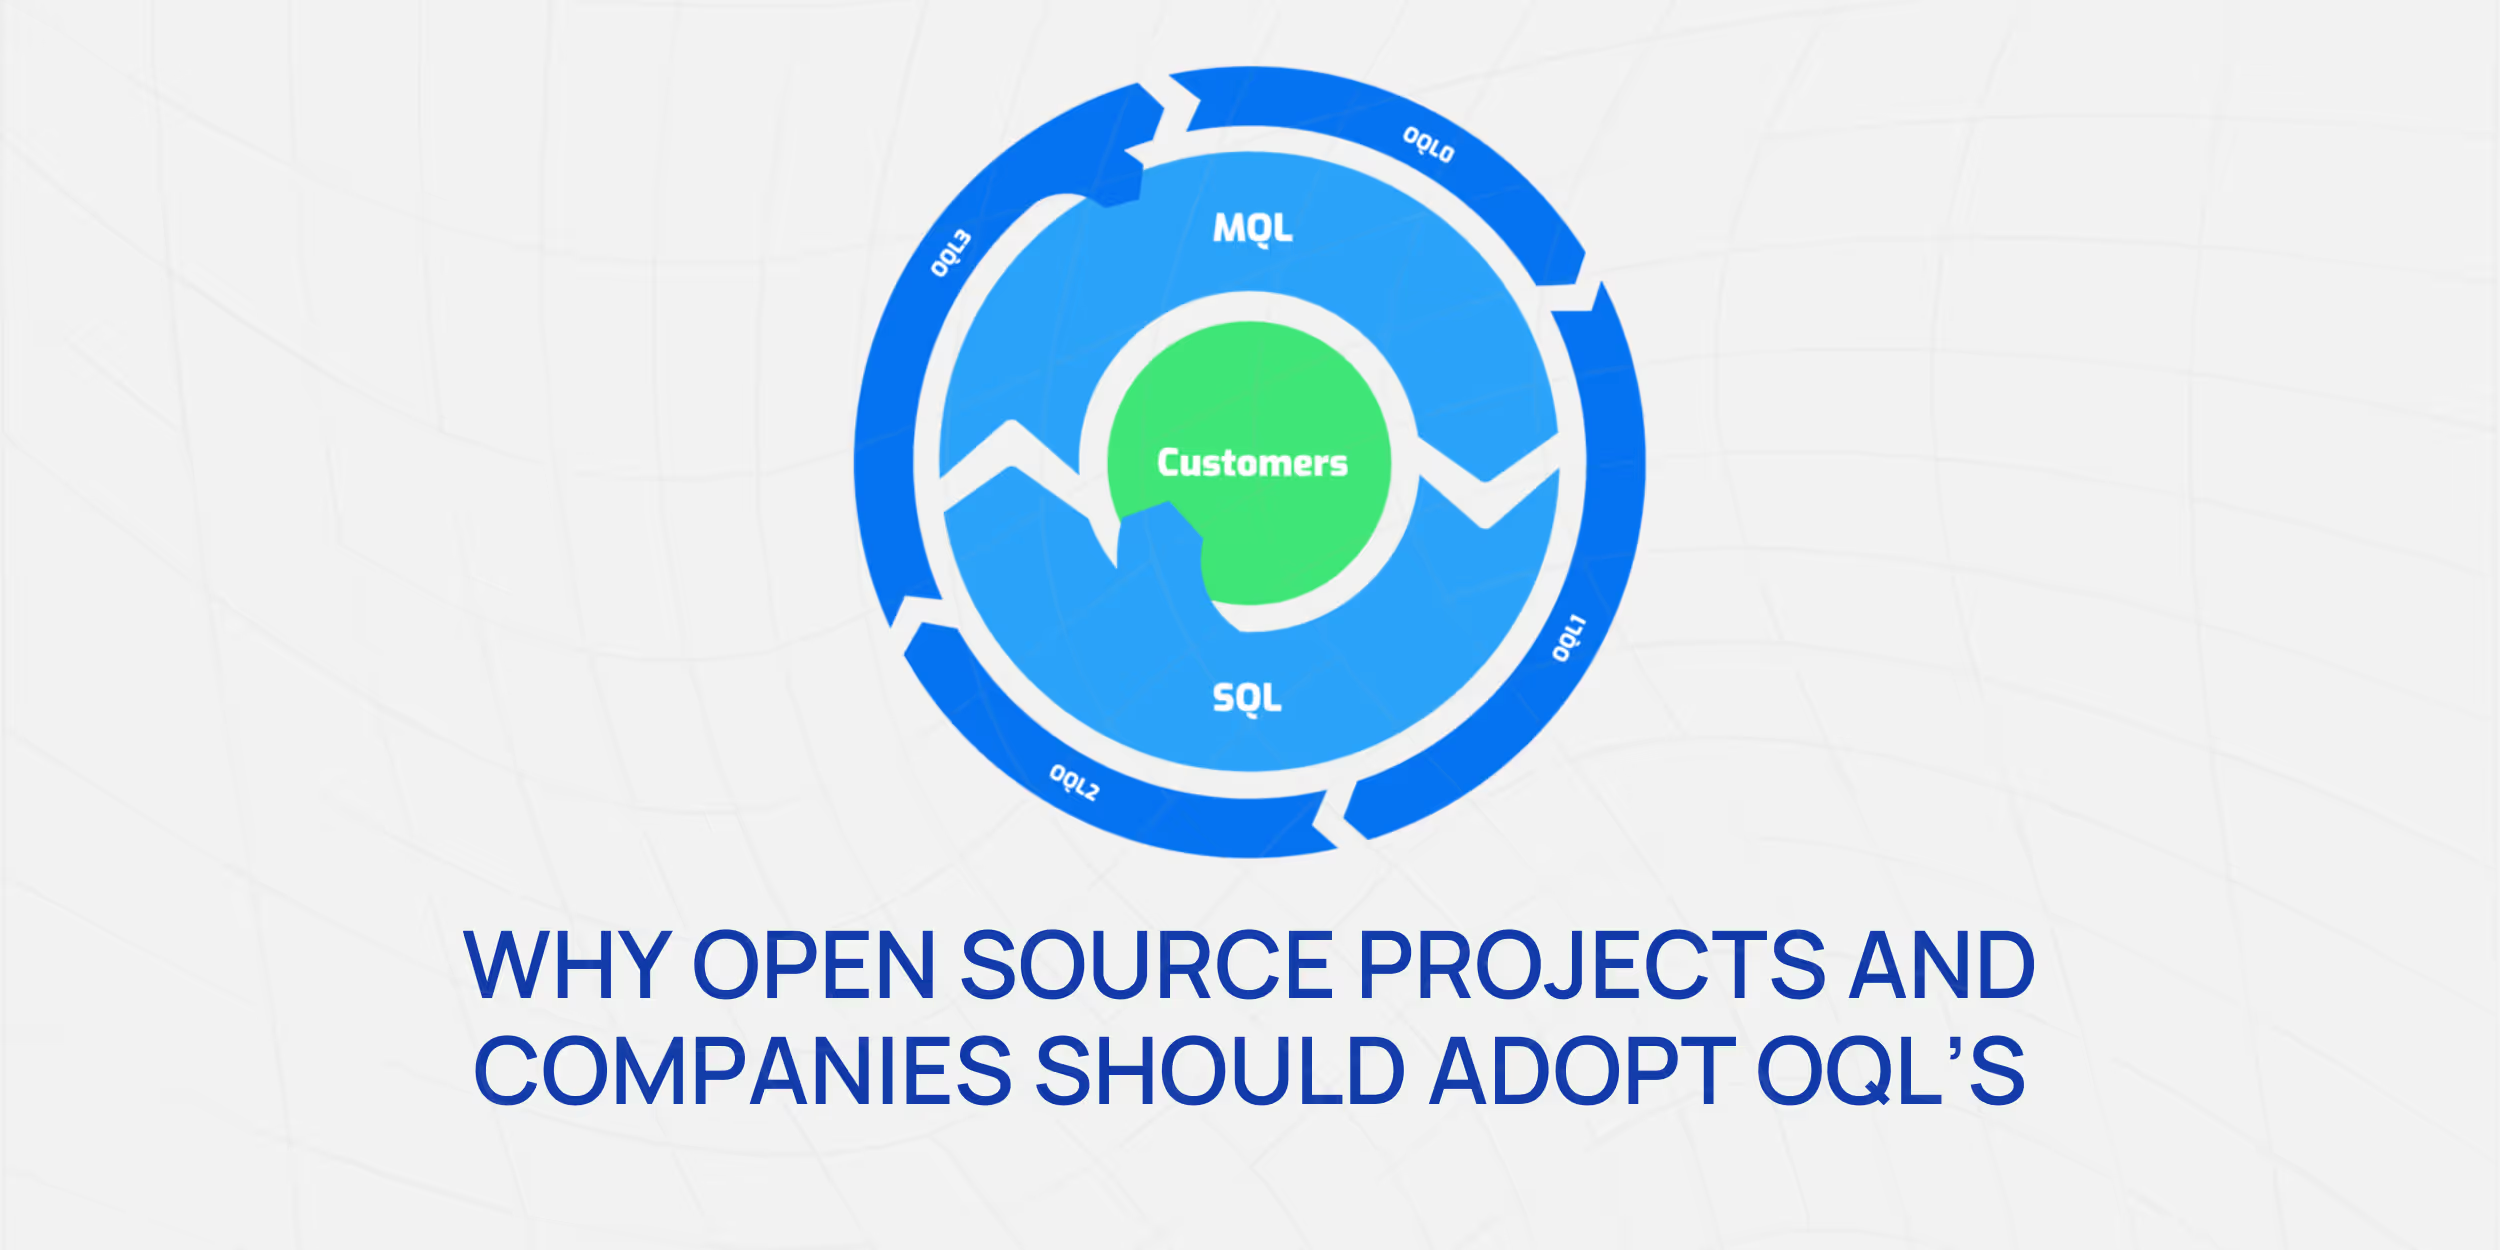
Why Open Source Projects and Companies Should Adopt "Open Source Qualified Leads"
The modern digital age, driven by the proliferation of open-source projects, is as much about community as it is about the code. This means understanding and engaging with potential adopters, contributors, and users becomes critical for the health and success of a project or product. Here enters the concept of "Open Source Qualified Leads" (OQL).
Mastering Telemetry in Open Source: A Simple Guide to Building Lightweight Call Home Functionality
Implementing a call-home functionality or telemetry within open-source software often raises privacy concerns within the community. Many parties, including enterprise security teams, customer advocates, and developers, express rightful apprehensions about the transmission, storage, and usage of data.
