Below the Surface: Why Open Source Needs Analytics
Understanding open source user engagements and usage is obscured by a lack of actionable data, a result of its inherent openness and anonymity. Metrics like GitHub stars and number of contributors barely scratch the surface, failing to paint the full picture of project health. Having more contributors than other similar projects may look good on paper, but that doesn't directly translate to more users. Similarly, an increase in the number of contributors, pull requests, or issues on GitHub may seem promising, but doesn't necessarily indicate growth in your project's user base.

Understanding open source user engagements and usage is obscured by a lack of actionable data, a result of its inherent openness and anonymity. Metrics like GitHub stars and number of contributors barely scratch the surface, failing to paint the full picture of project health. Having more contributors than other similar projects may look good on paper, but that doesn’t directly translate to more users. Similarly, an increase in the number of contributors, pull requests, or issues on GitHub may seem promising, but doesn’t necessarily indicate growth in your project’s user base.
There’s a frequent misconception that measuring metrics is only driven by commercial motives. Every community, including projects that are focused on creating positive outcomes and expanding the ecosystem, should understand themselves. Only then, can a project truly understand their impact.
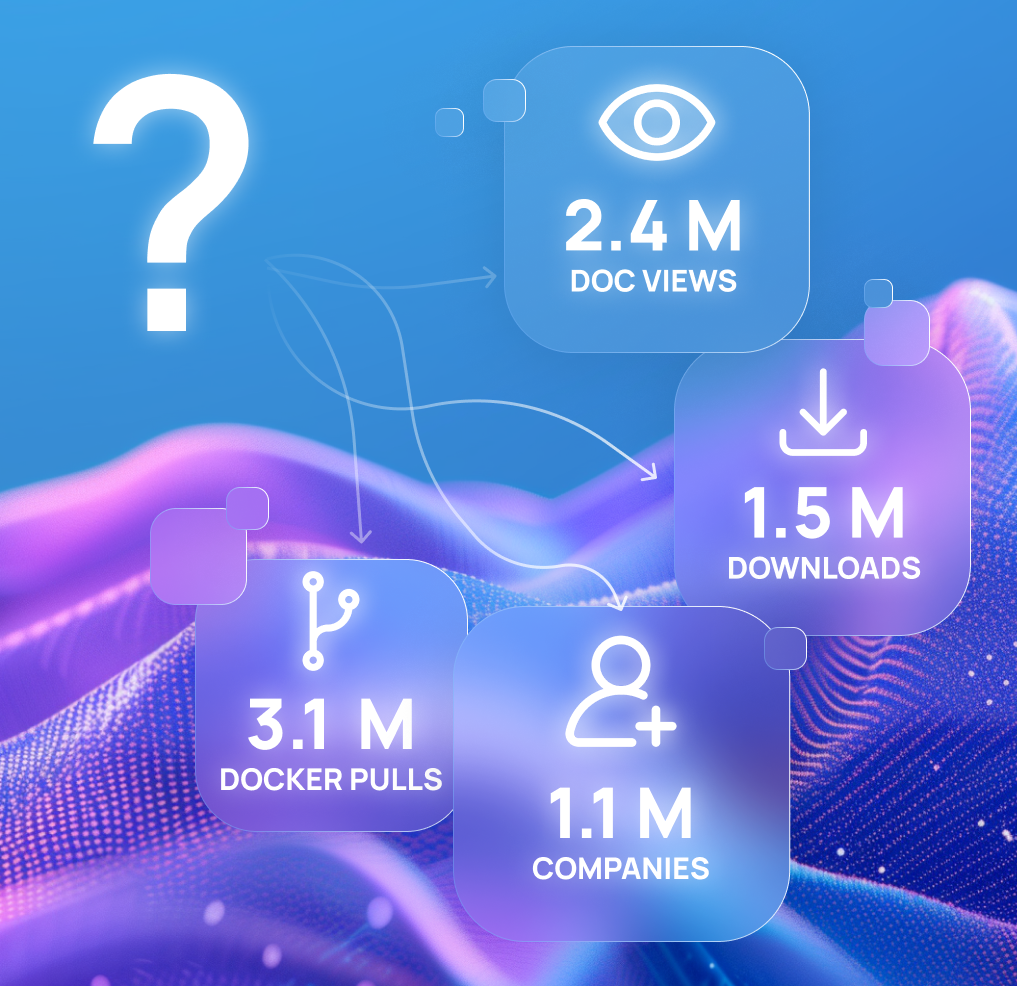
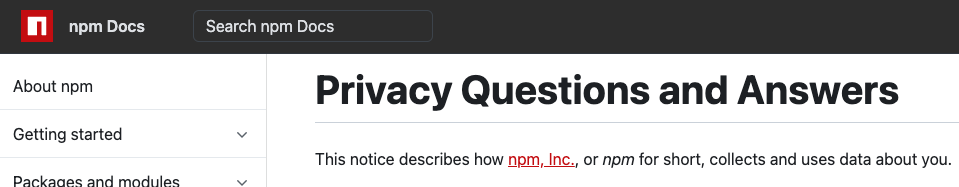
Metrics have long been collected by companies in the open source space, and it’s becoming increasingly common and accepted. Registries like npm already gather data on how users interact with software, registries, websites, and documentation, as well as account and package information. Similarly, platforms like GitHub inform high-level metrics such as stars, forks, and pull requests.

There are a lot of key metrics that directly reflect the health and ongoing growth of your project. Whether you’re building an open source business or maintaining a project on the side, the right set of growth metrics provides insight into what is and is not working and what adjustments need to be made. Usage analytics bring with them the knowledge of which versions are being used, documentation is being read, and features are most popular. Without real data, especially from distribution sites maintainers don’t own, they end up relying on experience and hope, opening themselves to giant blind spots when it comes to decision-making.
Maxime Beauchemin, founder & CEO of Preset, highlighted the importance of metrics in one of our recent case studies: “If you care about open source, you should care about the metrics of your project.”
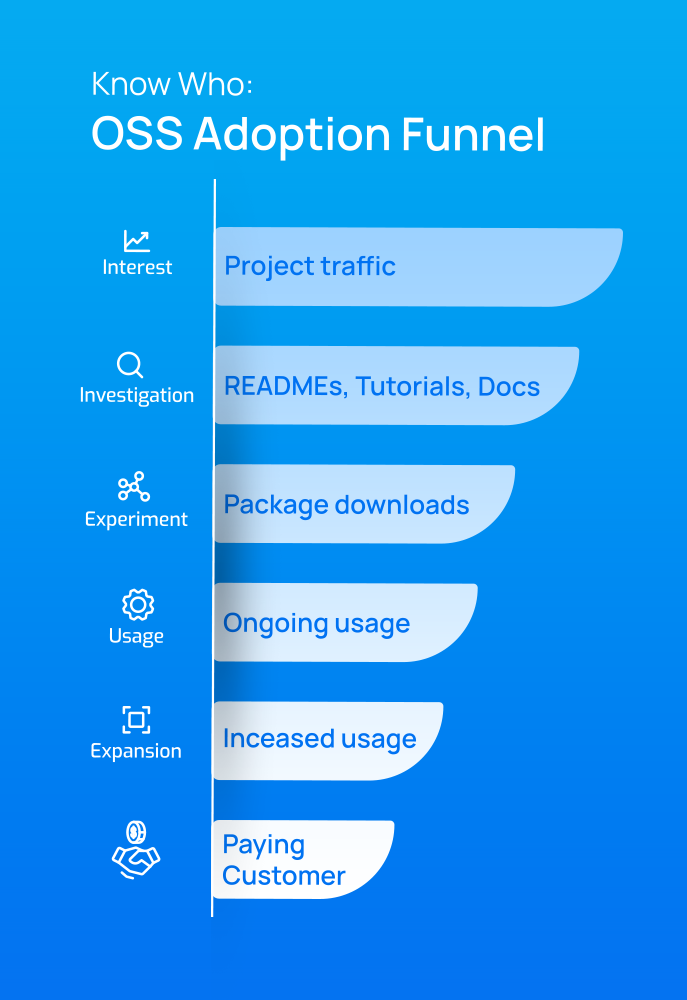
To accurately interpret metrics, they must be viewed within the context of an open source adoption funnel, which tracks user stages from discovering your project to deploying it in production and beyond. Scarf defines these stages as Interest, Investigation, Experiment, Ongoing Usage, and Paying Customer. Contextualizing metrics in these stages helps optimize activities, track usage trends, identify ideal customer profiles, and highlight opportunities and risks, such as early indicators of churn or documentation needing updates.
Measuring growth and health can be a challenge. The sheer variety of sources your users can access your artifacts from make it difficult to get a complete picture. Traditional analytics tools often rely on methods that cause privacy concerns, further complicating things. Moreover, website and documentation analytics are obstructed by intrusive cookie banners, and the limitations of JavaScript-based analytics.
These challenges are common among maintainers and commercial open source entities. As members of the Scarf Team and active participants of the open source community, we’ve encountered these issues first-hand. Like many others, we’ve struggled with the need for privacy-conscious and actionable data on our own OSS projects.
Embracing a data-driven approach to open source projects helps them not only grow, but also understand the keys to their success, benefiting everyone involved. This approach can also serve commercial goals, which is essential for business growth and sustainability. As active members of the open source community, the Scarf Team is dedicated to providing the tools needed for clarity and success.
If you haven’t already, sign up to try Scarf for free.
Introducing Dependency Radar
A new real-time supply chain security feed from open source downloads tracked by Scarf

Introducing Scarf's New Pricing Model
Today we are launching a new pricing model for new Scarf accounts going forward, and we'd love your feedback. For customers already on a paid Scarf plan, your billing will not be impacted by this change.
Scarf Go SDK is Now Available
Scarf's Go SDK is now available on GitHub. You can now send telemetry to Scarf from your Golang code more easily than ever, with things like user opt-out being managed for you.
